Harmful Algae Bloom Data

HABSOS Cell Count map screenshot, showing data off the West and North coasts of Florida, and the coasts of Alabama and Mississippi.
Cyanobacteria
Water quality data was collected by the United States Army Corps of Engineers at numerous locations along the shore of Lake Ponchartrain, Louisiana during the month of September 2019. The parameters collected include chlorophyll a (uncorrected), chlorophyll b, chlorophyll c1 + c2, phycocyanin, microcystin, water temperature, dissolved oxygen, dissolved oxygen percent saturation, pH, salinity, and specific conductance.
Florida
Florida's cell counts are reported by a network of monitoring entities. These entities include: Florida Fish and Wildlife Research Institute (FWRI), Mote Marine Laboratory (MML), Sarasota County Health Department (SCHD), and Collier County Pollution Control and Prevention Department (CCPCPD).
Texas
The Texas Parks and Wildlife Department (TPWD) is the lead agency involved in Texas marine harmful algal blooms. All of the cell counts within Texas boundaries are collected and reported by TPWD.
Mississippi
The Mississippi Department of Marine Resources (MDMR) collects phytoplankton samples for routine analysis of oyster growing waters open to harvest and responsive (emergency) samples. During routine sampling, staff collect 1 sample each month from open oyster growing areas within the Mississippi Sound. An in-house qualitative analysis is conducted and if a toxic bloom is present, a quantitative analysis will be conducted. The cell count data from the quantitative analysis will be reported. Responsive sampling occurs when the MDMR receives a report of a bloom from a credible source. In addition, field technicians are trained to make observations while collecting fisheries samples throughout the week.
Alabama
Alabama has about 100 miles of coastline along the Gulf and Mobile Bay. The Alabama Department of Public Health -Seafood Branch (ADPH) in collaboration with Alabama Department of Environmental Management (ADEM) collects and monitors for Harmful Algal Bloom (HAB) species under the regulation and guidance of the FDA. Toxic HAB species of concern in Alabama waters are: Karenia brevis, Dinophysis and Pseudo-nitzschia.
U.S. Government
NOAA National Centers for Environmental Information (NCEI) manages HABSOS, the world's largest archive of publicly available oceanographic data.
Meteorology
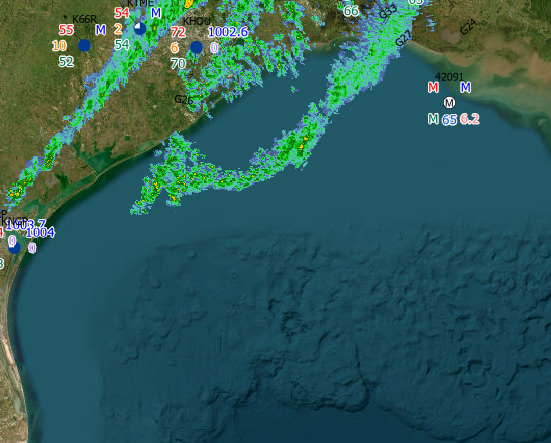
HABSOS meteorology layer (radar and weather station observations) map screenshot example.
In-Situ Measurements
Weather Radar
The National Weather Service (NWS) creates a base reflectivity image from a network of Doppler radars. This image is updated hourly and can be used to monitor current precipitation.
Weather Observations
Compilation of weather stations from both marine and land. These stations report observed conditions from the previous 3 hours. Marine stations may report additional oceanographic data such as wave height.
Models
Aerosol Observation Forecast
The Aerosol Observation Forecast layer are images downloaded from the US Global Ocean Data Assimilation Experiment (USGODAE). The images are generated by the Naval Research Laboratory, Monteray, CA, from data representing the concentration of aerosols such as smoke or dust. A common source of these are wildfires, wind transport from the Saharan Desert, among other sources (more information).
NWS Air Temperature
The National Digital Forecast Database (NDFD) contains a seamless mosaic of the National Weather Service's (NWS) digital forecasts of air temperature. In collaboration with NWS National Centers for Environmental Prediction (NCEP) and NWS Weather Forecast Offices (WFO), the central NDFD server ingests 5-km, 2-dimensional grids of air temperature, and creates experimental forecast data mosaics for the coterminous United States (CONUS), Alaska, Hawaii, and Guam. These data are updated daily on the HABSOS page to get the 24, 48, and 72 hour forecasts for air temperatures.
NWS Probability of Precipitation Amount (Forecasts) nowCOAST
The National Digital Forecast Database (NDFD) contains a seamless mosaic of the National Weather Service's (NWS) digital forecasts of precipitation probabilities. In collaboration with NWS National Centers for Environmental Prediction (NCEP) and NWS Weather Forecast Offices (WFO), the central NDFD server ingests 5-km, 2-dimensional grids of precipitation probabilities, and creates experimental forecast data mosaics for the coterminous United States (CONUS), Alaska, Hawaii, and Guam. These data are updated daily on the HABSOS page to get the 24, 48, and 72 hour forecasts for precipitation probabilities.
NWS Precipitation Amounts (Forecasts)
The National Digital Forecast Database (NDFD) contains a seamless mosaic of the National Weather Service's (NWS) digital forecasts of precipitation amounts. In collaboration with NWS National Centers for Environmental Prediction (NCEP) and NWS Weather Forecast Offices (WFO), the central NDFD server ingests 5-km, 2-dimensional grids of precipitation amounts, and creates experimental forecast data mosaics for the coterminous United States (CONUS), Alaska, Hawaii, and Guam. These data are updated daily on the HABSOS page to get the 24, 48, and 72 hour forecasts for precipitation amounts.
Wind Speeds (Forecasts)
The NOAA National Weather Service's (NWS) Environmental Modeling Center (EMC) generates meteorological forecasts from the NAM computer model on a 6-hour cycle, daily. Each cycle provides forecasts from zero hours out to 84 hours and provides predictions for a number of different variables including wind speed and direction. This data set was created by extracting surface wind speed and direction values for a defined geographic region from the NAM-12 data made available by the EMC on an FTP server. These data are updated daily on the HABSOS page to retrieve the 0, 12, 24, 36, 48, and 72 hour forecasts.
Oceanography
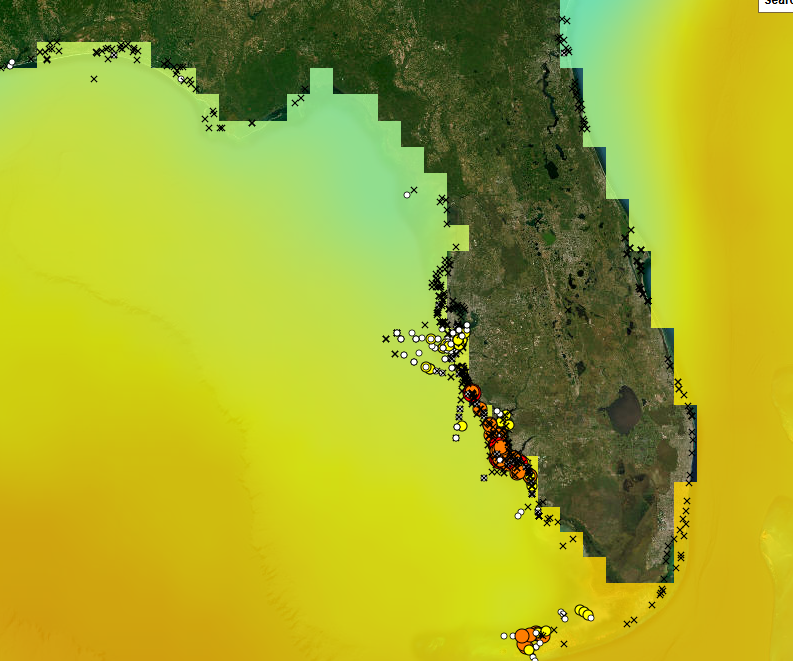
HABSOS Daily Optimum Interpolation Sea Surface Temperature (DOISST) layer screenshot off of the Florida coast.
In-Situ Measurements
National Data Buoy Center (NDBC)
Near real-time observational recordings for NDBC buoys and non-NDBC buoys. These buoys record wind speed and direction, wave heights, surface atmospheric pressure, visibility, air temperature, water temperature, and salinity.
Texas Automated Buoy System (TABS)
Measures oceanographic parameters in near real-time from buoys off the Texas coast from Brownsville, TX to Sabine, TX. The Texas General Land Office supports this system as part of its mission to mitigate the effect of catastrophic oil spills on the Texas Coast. HABSOS accesses the buoy information and provides current direction and velocity on the mapping service on a daily basis.
NOS CO-OPS Port Traffic Buoys
The NOAA National Ocean Service Physical Oceanographic Real-Time System (PORTS) is set-up in United States ports to help with the safe navigation of ships. PORTS station locations are displayed and links to these stations are provided via the map.
Climatology
NCEI Historical Water Temperatures
NCEI's World Ocean Atlas 2005 provides objectively analyzed (1° grid) monthly climatological fields of historical in situ water temperature. Surface water temperatures are made available via NCEI.
Models
Sea Surface Currents
Navy Coastal Ocean Model (NCOM) American Seas (AmSeas) was developed by the Naval Research Laboratory with further refinements to the model for the Gulf and the Caribbean creating the AmSeas. Forecasts of sea surface currents are updated by NCEI once daily to provide 0, 24, and 48 hour models. Hindcasts for the past 30 days of model runs are also available.
Sea Surface Heights
Navy Coastal Ocean Model (NCOM) American Seas (AmSeas) was developed by the Naval Research Laboratory with further refinements to the model for the Gulf and the Caribbean creating the AmSeas. Forecasts of sea surface heights are updated by NCEI once daily to provide 0, 24, and 48 hour models. Hindcasts for the past 30 days of model runs are also available.
Sea Surface Salinities
Navy Coastal Ocean Model (NCOM) American Seas (AmSeas) was developed by the Naval Research Laboratory with further refinements to the model for the Gulf and the Caribbean creating the AmSeas. Forecasts of sea surface salinities are updated by NCEI once daily to provide 0, 24, and 48 hour models. Hindcasts for the past 30 days of model runs are also available.
Sea Surface Water Temperatures
Navy Coastal Ocean Model (NCOM) American Seas (AmSeas) was developed by the Naval Research Laboratory with further refinements to the model for the Gulf and the Caribbean creating the AmSeas. Forecasts of sea surface water temperatures are updated by NCEI once daily to provide 0, 24, and 48 hour models. Hindcasts for the past 30 days of model runs are also available.
Remotely Sensed Imagery
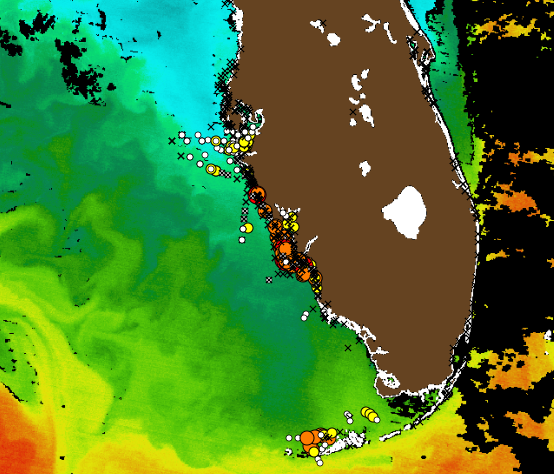
HABSOS remote sensing layer screenshot (sea surface temperature from USF), showing data off the Florida coast.
NOAA CoastWatch
Chlorophyll 3-day Composite
The Chlorophyll 3-day Composite layer is produced from near-surface chlorophyll concentration measurements collected by the Moderate Resolution Imaging Spectroradiometer (MODIS) carried aboard NASA's Aqua Spacecraft. The images are collected daily and combined into a 3-day composite for greater coverage.
Chlorophyll Anomaly
The Chlorophyll Anomaly layer is created by comparing a specific day’s value against a bi-monthly mean (61 days). These measurements are collected by the Moderate Resolution Imaging Spectroradiometer (MODIS) carried aboard NASA's Aqua Spacecraft.
USF Marine Remote Sensing Group
Chlorophyll - Monthly Climatology
The monthly average of Chlorophyll -a values, the photosynthetic pigment of plankton, collected by the Moderate Resolution Imaging Spectroradiometer (MODIS) carried aboard NASA's Aqua Spacecraft.
USF Optical Oceanography Laboratory
Enhanced True Color (RGB)
Created by observations from measurements collected by the Moderate Resolution Imaging Spectroradiometer (MODIS) carried aboard NASA's Aqua Spacecraft. The layer represents what we might see with our own eyes by utilizing red, green, and blue channels and some information from near infrared.
Normalized Fluorescence Line Height
Created from observations collected by the Moderate Resolution Imaging Spectroradiometer (MODIS) carried aboard NASA's Aqua Spacecraft. This is a measurement of solar stimulated chlorophyll fluorescence by interpolating Chlorophyll a values measured at the 678 nm band against the values observed at the bands above and below.
Sargassum Density
The Sargassum Density layer includes images downloaded from the University of South Florida Optical Oceanography Labratory. The images are produced from data captured by the Moderate Resolution Imaging Spectroradiometer (MODIS) aboard the satellite Aqua.
Sea Surface Temperature
Derived from processed satellite observations. These data are usually within 0.5 degrees Celsius uncertainty for ocean areas and 1 degree Celsius uncertainty for coastal areas.
Foundation Layers
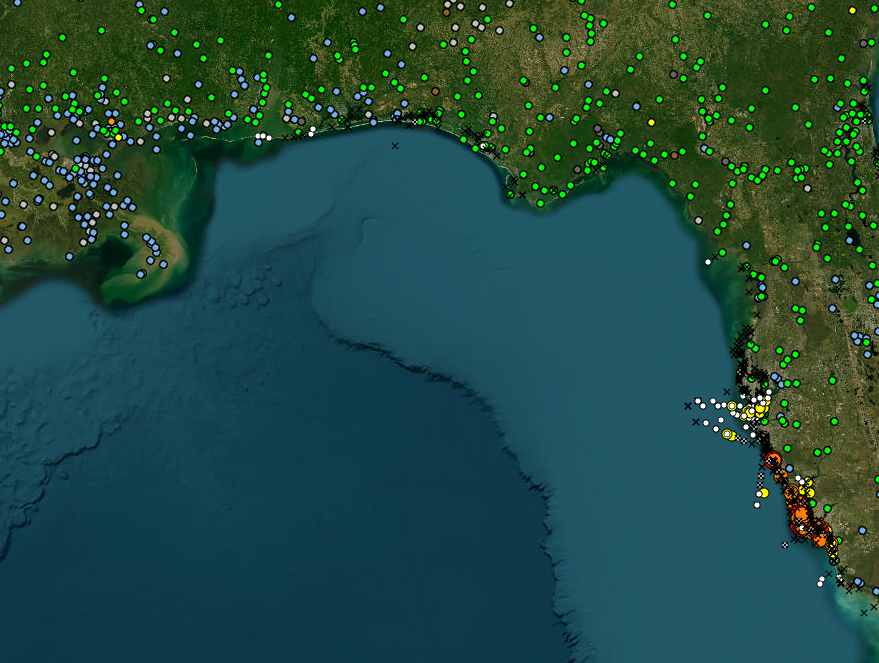
HABSOS foundation layer (U.S. river streamflow) screenshot, showing data off the coasts of Florida, Alabama, Mississippi and Louisiana.
U.S. River Streamflow
The USGS maintains a network of streamflow stations throughout the United States and its territories. This layer shows the current stage/status of each of the USGS stream gauges.
Bathymetry
This layer provides bathymetric contours with increasing resolution in coastal areas. Sets of contours were generated at 100, 200, 1000, 2000, 3000, 4000, 5000, and 6000 meter depths.
Estuarine Reserves
The National Estuarine Research Reserve System (NERRS) seeks to preserve unique coastal habitats for long-term research, water-quality monitoring, education and coastal stewardship. The sites are managed through a partnership between NOAA and local state government.
The five Gulf Coast reserve sites are all excellent sources for up-to-date and long-term monitoring data.
Marine Sanctuaries
The National Marine Sanctuary System (NMSS) seeks to protect critical habitats, unique environments, and sites of historical significance. The Gulf Coast hosts two marine sanctuaries, the Florida Keys and the Flower Garden Banks.
Eastern Oyster Reefs
The Eastern Oyster feeds on single celled marine phytoplankton. During a harmful algal bloom, oysters can become toxic with the accumulated toxins of the harmful algae. These data display oyster reefs that have been mapped.